
Xorg drivers, software rendering for 2D graphics and cairo 1.12 performance
Recently cairo graphics library got an update to version 1.12. It brings some nice performance improvements as demonstrated in three blog posts from Chris Wilson. These blog posts additionally showcase Intel SNA, which happens to be quite an impressive DDX driver. It provides 2D graphics hardware acceleration for X applications via XRender extension and is clearly doing this faster than software rendering.
It may really surprise some people, but graphics drivers are generally doing not so great for 2D acceleration on linux desktop systems. This has been known at least since 2003, when Carsten Haitzler (aka Rasterman) started a thread about XRender performance and posted render_bench test program. Also hardware acceleration did not have a clear advantage over software rendering two years ago for many cairo traces (which are much more relevant for 2D benchmarking than render_bench). There are some old slides from 2010 presented by Intel folks about "Making the GPU do its Job" explaining the challenges they were facing at that time. But now this long quest seems to be over and we got really good 2D drivers at least for Intel hardware.
But enough with the historical overview. The purpose of this blog post is to look into cairo "image backend" in a bit more details and try to find an explanation why it managed to be competitive for such a long time (and is still able to wipe the floor with some poorly implemented GPU accelerated drivers even now). Cairo image backend uses pixman library as a software rasteriser. To speed up the graphics operations, pixman uses SIMD optimizations. The most relevant are SSE2 on x86 and NEON on ARM. There are also optimizations for MIPS32 DSP ASE, Loongson SIMD and ARM IWMMXT being worked on. The latest pixman 0.25.2 development snapshot allows to selectively disable SIMD optimizations without recompiling the library, which is convenient for benchmarking or testing. I'm going to run cairo-perf-trace benchmark on a few devices I have at home, testing image backend both with and without SIMD optimizations enabled. This allows to to see how much of the performance is gained by using "SIMD acceleration" in pixman and benchmark it against "GPU acceleration" in the xorg drivers.
Test setup
32bpp desktop color depth is used in all tests. Cairo 1.12.0 and pixman 0.25.2 are compiled with gcc 4.7.0 with "-O2" optimizations and "-march/-mcpu/-mtune" options set to match the target processor. The standard set of cairo benchmark traces is used, but "ocitysmap" trace is removed (it is a memory hog and runs out of memory on 512MB systems without swap). The detailed instructions are available in the last section of this blog post.
ARM Cortex-A9 1.2GHz (Origenboard)
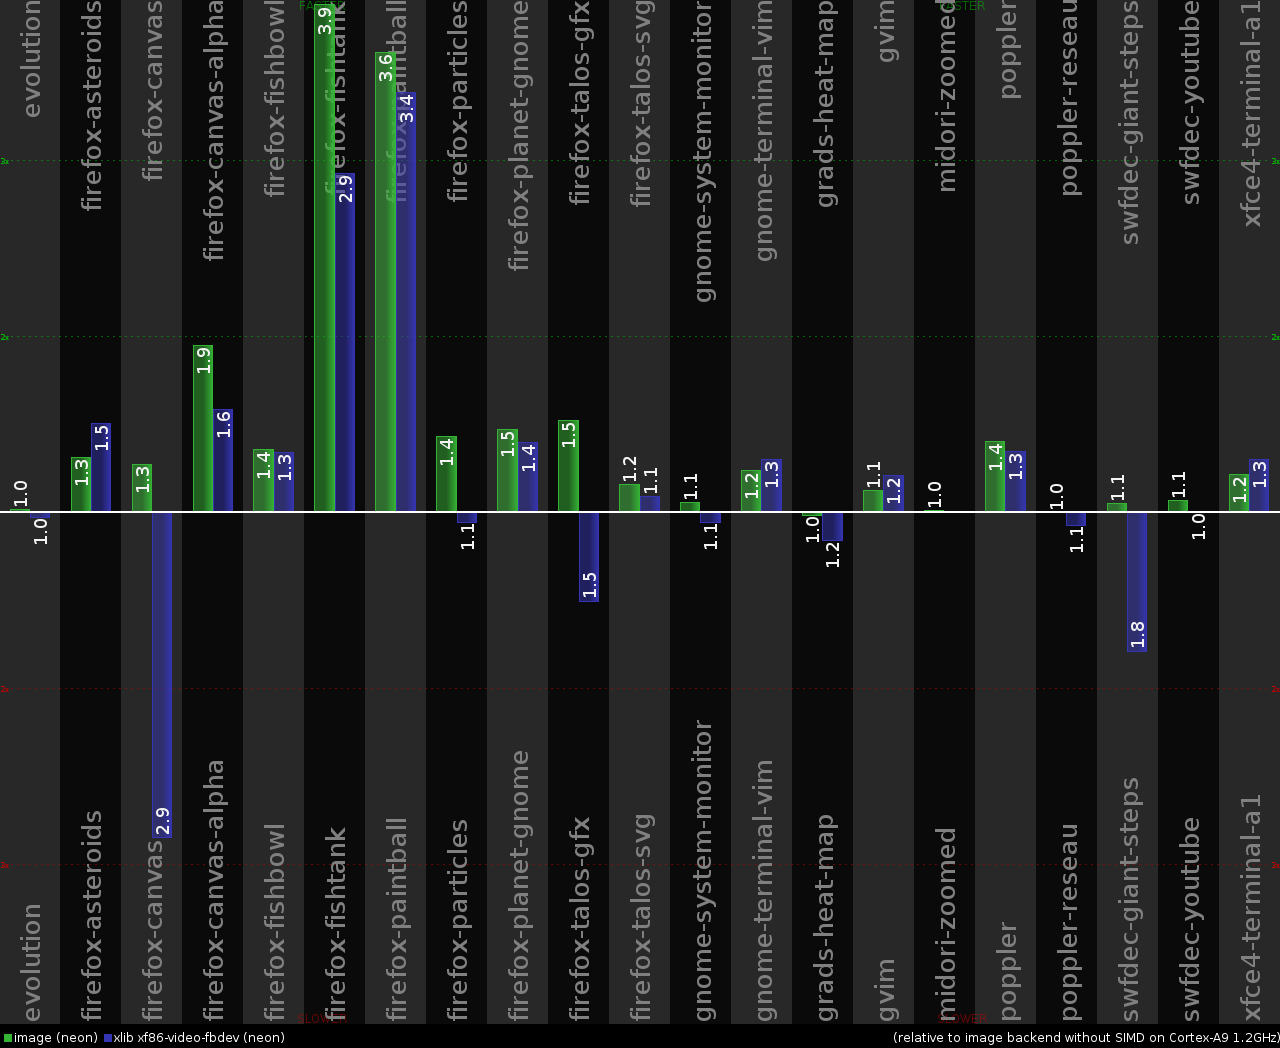
On the chart above everything is compared to cairo image backend when SIMD optimizations are disabled in pixman (PIXMAN_DISABLE environment variable is set to "arm-simd arm-iwmmxt arm-neon"). The green bars on the left show the performance improvement gained by enabling ARM NEON in pixman when running the tests with cairo image backend. The blue bars on the right show the performance of xlib cairo backend when the rendering is done on the X server side by xf86-video-fbdev driver (which in turn uses pixman with NEON optimization enabled).
Looking at these colored bars, we can see that xlib backend is generally performing worse than image backend. It is understandable, because we have some inter-process communication overhead between the test application and X server, X11 protocol marshalling, etc. But a few tests (firefox-asteroids, gnome-terminal-vim, gvim, xfce4-terminal-a1) showed an improvement. The explanation here is that this system has a dual-core processor. So the X server running on one CPU core is acting as a 2D accelerator, and the test application has another CPU core free for use. If we look at the CPU usage in htop while running the tests, then we see that the CPU core running Xorg server is ~100% loaded, and the other CPU core running cairo-perf-trace process is typically just ~15-30% loaded.
So in the end, xlib backend is not so bad on multi-core systems. We just need to ensure that we are not hit by any unnecessary overhead on the inter-process communication. Are we actually doing well here? Not even close! Just look at this part of code. There we see how X server is wrapping its internal Picture structures into temporary pixman_image_t structures, involving lots of overhead, validity checks and malloc/free activity. No surprise that we are taking a serious performance hit, firefox-canvas trace being the worst.
The colored bars on the performance chart above surely look nice, but the system needs to be snappy and responsive on normal use. Believe me or not, it is quite ok. For example, I can use text editors in the terminal and move windows around without perceivable lags. But what about the ARM system with similar specs, also used with the xf86-video-fbdev driver and reviewed in a Phoronix article? Don't know, but looks like somebody has just screwed up something. When we are moving windows around, it's just memcpy/memmove alike operation. Origenboard can reach ~700-750 MB/s speed for memcpy, OMAP4460 should be quite similar. Even with FullHD resolution and 32bpp desktop color depth (16bpp is more common on ARM systems), we are moving around up to 1920 * 1080 * 4 = ~8.3 MB of pixel data. Dividing memcpy speed by data size, we get ~80-90 FPS. Even if we assume that shadow framebuffer is getting in the way and further divide the FPS number by 2, that's still more than enough not to experience any problems on moving or scrolling windows. Sure, this is fully occupying one CPU core for something as dumb as just memory copy, but another CPU core is free and the whole system is not affected that badly.
Finally what about GPU acceleration? This board uses Exynos4210 SoC, which has Mali-400 MP4 GPU. Right now I'm waiting for limadriver or FIMG2D based DDX. There are proprietary drivers for Mali GPU, but I don't want to taint this system with proprietary blobs yet, and also don't want to taint myself by agreeing to any licenses accompanying them.
ARM Cortex-A8 1GHz, GPU SGX530 200MHz (IGEPv2 board)
The same tests as for Cortex-A9, but also adding the results for 2D graphics hardware acceleration provided by the latest 2012 1Q SGX driver release. First of all, not all tests are even able to run with sgx pvr xorg driver. Looks like it has a limit of just around ~60MB for the total pixmap data allocated on X server side and this prevents many cairo traces from running:
X Error of failed request:  BadAlloc (insufficient resources for operation)
  Major opcode of failed request:  53 (X_CreatePixmap)
I tried to increase this limit by using an undocumented option "PixmapPoolSizeMB" in xorg.conf, but that did not help much and caused some additional stability issues. In the end I decided not to touch this stuff and run it as-is in default configuration (only upgrading pixman from ancient version 0.18.4 to 0.25.2). Hence the pvr driver only has results for 8 out of 21 tests on the chart below due to the restricted pixmap pool size.
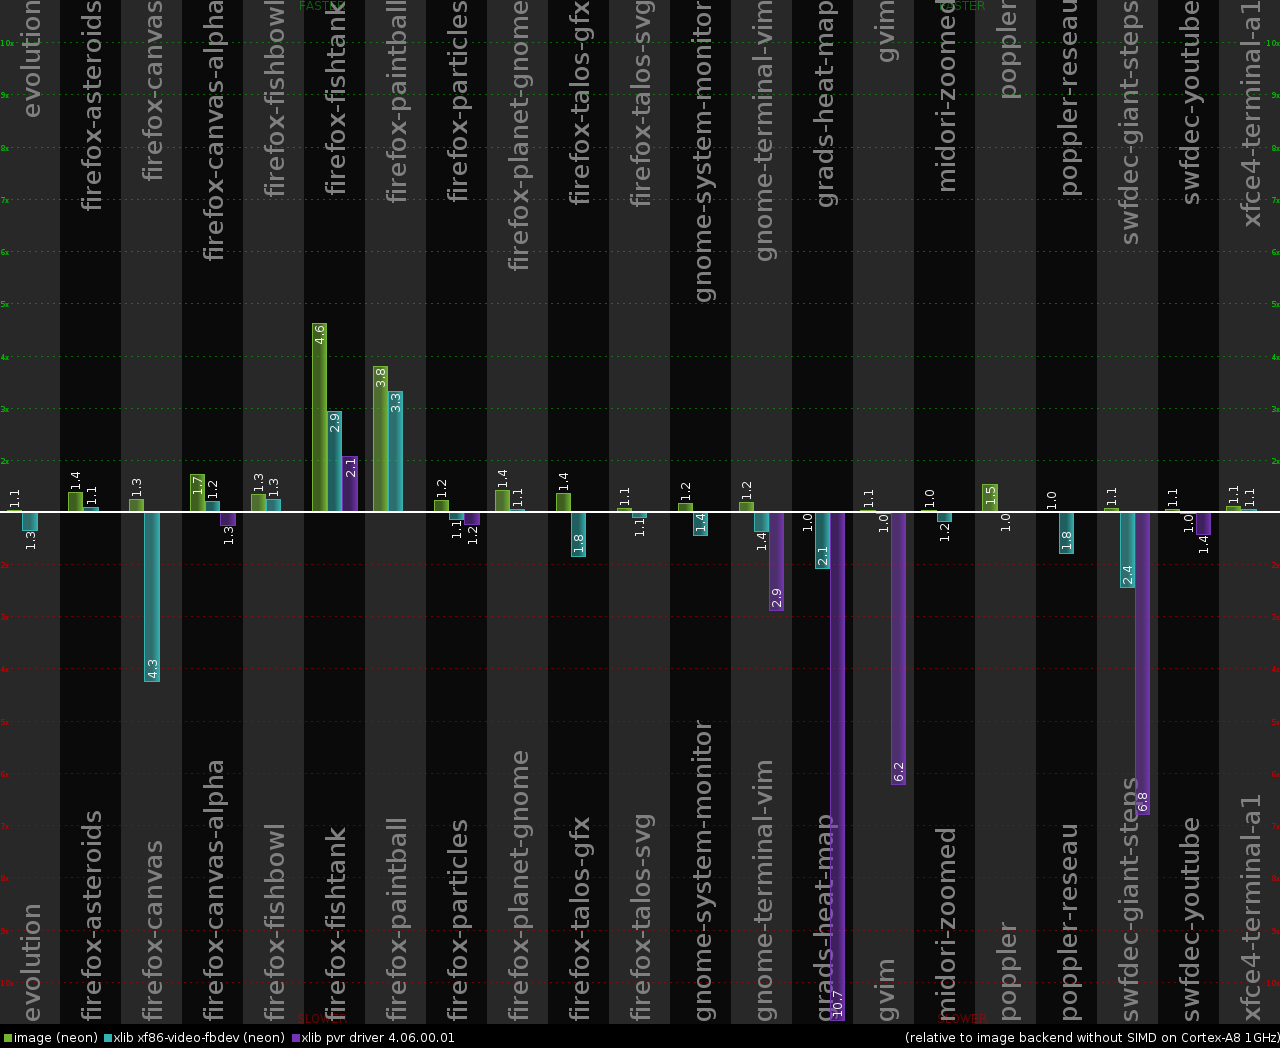 Ouch! The performance results do not look good for the pvr driver. It was never able
to get any close to the fbdev driver, let alone to the client side rendering via cairo
image backend. And this time fbdev driver was always slower than image backend, which is not
surprising because there is only one ARM Cortex-A8 core in this device.
Ouch! The performance results do not look good for the pvr driver. It was never able
to get any close to the fbdev driver, let alone to the client side rendering via cairo
image backend. And this time fbdev driver was always slower than image backend, which is not
surprising because there is only one ARM Cortex-A8 core in this device.
But let's forget about the traces of real applications for a moment. Is the pvr driver even able to accelerate anything? Now we can take a look at synthetic benchmarks like render_bench (with a bugfix applied), which stresses simple scaled and non-scaled compositing using Over operator. In other words, that's one of the most basic operations for 2D graphics (commonly used for translucency effects), which is expected to be properly accelerated by any driver. Test results for the fbdev driver and for the pvr driver (with and without "NoAccel" option set in xorg.conf) are listed in the table below (render_bench logs are here). Each test was also repeated with and without NEON SIMD optimizations enabled in pixman. And an interesting bonus comparison is imlib2 vs. pixman C implementation (CFLAGS="-O2 -mcpu=cortex-a8 -mfloat-abi=softfp -mfpu=neon" for both pixman and imlib2):
| pixman 0.25.2 with NEON | pixman 0.25.2 without NEON | imlib2 1.4.4 | ||||||
|---|---|---|---|---|---|---|---|---|
| fbdev | pvr (NoAccel) | pvr | fbdev | pvr (NoAccel) | pvr | built with gcc 4.5.3 | built with gcc 4.7.0 | |
| Xrender doing non-scaled Over blends | 0.56 sec | 0.76 sec | 1.33 sec | 1.58 sec | 3.86 sec | 1.33 sec | - | - |
| Xrender (offscreen) doing non-scaled Over blends | 0.44 sec | 0.44 sec | 1.23 sec | 1.40 sec | 1.41 sec | 1.23 sec | 1.16 sec | 1.21 sec |
| Xrender doing 1/2 scaled Over blends | 0.42 sec | 0.40 sec | 0.42 sec | 0.55 sec | 1.02 sec | 1.07 sec | - | - |
| Xrender (offscreen) doing 1/2 scaled Over blends | 0.27 sec | 0.27 sec | 0.32 sec | 0.42 sec | 0.43 sec | 0.48 sec | 0.40 sec | 0.42 sec |
| Xrender doing 2* smooth scaled Over blends | 3.65 sec | 8.74 sec | 8.76 sec | 25.45 sec | 50.63 sec | 50.69 sec | - | - |
| Xrender (offscreen) doing 2* smooth scaled Over blends | 3.44 sec | 3.45 sec | 3.62 sec | 25.02 sec | 25.04 sec | 25.25 sec | 14.21 sec | 12.92 sec |
| Xrender doing 2* nearest scaled Over blends | 2.26 sec | 3.68 sec | 3.72 sec | 4.27 sec | 14.00 sec | 14.04 sec | - | - |
| Xrender (offscreen) doing 2* nearest scaled Over blends | 2.01 sec | 2.04 sec | 2.24 sec | 4.01 sec | 4.02 sec | 4.15 sec | 5.26 sec | 5.65 sec |
| Xrender doing general nearest scaled Over blends | 5.57 sec | 7.68 sec | 7.72 sec | 6.18 sec | 19.92 sec | 19.96 sec | - | - |
| Xrender (offscreen) doing general nearest scaled Over blends | 5.23 sec | 5.37 sec | 5.60 sec | 5.96 sec | 5.97 sec | 6.04 sec | 8.90 sec | 9.59 sec |
| Xrender doing general smooth scaled Over blends | 8.66 sec | 18.40 sec | 18.42 sec | 55.98 sec | 111.73 sec | 111.78 sec | - | - |
| Xrender (offscreen) doing general smooth scaled Over blends | 8.44 sec | 8.44 sec | 8.58 sec | 55.18 sec | 55.31 sec | 55.50 sec | 57.04 sec | 43.71 sec |
The best results in the table above are highlighted with green, the worst results are highlighted with red. Only non-scaled tests showed the signs of hardware acceleration (low CPU load, same performance regardless of whether NEON is enabled in pixman or not), they are highlighted with blue. All the "non-blue" pvr driver tests are using fallbacks to pixman for software rendering. The other observations:
- fbdev is the fastest driver, showing equal or significantly better performance than the pvr driver
- disabling acceleration in the pvr driver is not enough to get really well performing software rendering (and this may be also true for many other xorg drivers)
- non-offscreen rendering is particularly slow for the pvr driver, especially when NEON is disabled. It suggests that fallbacks to pixman for software rendering may be working with non-cached memory buffers in this case.
- pixman without NEON and imlib2 have similar performance ("2* smooth scaling" stands out, but it probably has its own special optimized path in imlib2), NEON is significantly faster
Now let's have a closer look at the non-scaled test and do some profiling for it. In the original render_bench test, a 100x100 image is blended over 320x320 window. It means that the size of the working set is just 450KB, which is a bit too small for today's standards. ARM Cortex-A8 has 256KiB of L2 cache, and L2 cache is apparently providing a performance boost for fbdev driver here (0.56 sec vs. 1.33 sec, which is more than twice better than GPU). In order to make the test more fair and make CPU cache less useful, let's increase the window size to 1000x1000, increase the number of repetitions and run only "Xrender doing non-scaled Over blends" test first for the fbdev driver and then for the pvr:
=== fbdev driver (Time: 32.588 sec.) ===
samples|      %|
------------------
   148407 94.2817 Xorg
              TIMER:0|
      samples|      %|
    ------------------
       112860 76.0476 libpixman-1.so.0.25.2
        13326  8.9794 libshadow.so
        12679  8.5434 Xorg
         6072  4.0915 libc-2.13.so
         1976  1.3315 libfb.so
          787  0.5303 vmlinux
          369  0.2486 [vectors] (tgid:1719 range:0xffff0000-0xffff1000)
          217  0.1462 ld-2.13.so
           87  0.0586 fbdev_drv.so
           13  0.0088 libglx.so
           12  0.0081 libXfont.so.1.4.1
     4044  2.5691 vmlinux
=== pvr driver (Time: 41.911 sec.) ===
samples|      %|
------------------
   137617 76.5964 vmlinux
    35739 19.8920 Xorg
              TIMER:0|
      samples|      %|
    ------------------
         7455 20.8596 libsrv_um.so.1.7.783851
         6776 18.9597 Xorg
         4889 13.6797 vmlinux
         4699 13.1481 pvrsrvkm
         3474  9.7205 libc-2.13.so
         2857  7.9941 libpixman-1.so.0.25.2
         2224  6.2229 libexa.so
         1554  4.3482 pvr_drv.so
          743  2.0790 drm
          528  1.4774 libfb.so
          334  0.9346 libdrm.so.2.4.0
          126  0.3526 [vectors] (tgid:1690 range:0xffff0000-0xffff1000)
           38  0.1063 libpvr2d.so.1.7.783851
           14  0.0392 libglx.so
Based on the profiling results above we see that:
- Now that CPU cache is not helping much when working with large buffers, the performance difference between CPU and GPU has reduced significantly. CPU is still somewhat faster.
- There is "shadow framebuffer" impacting software rendering performance when drawing on screen, but I'll write more about it next time.
- Average CPU load is only ~20% when GPU acceleration is used, and the total amount of CPU time spent in Xorg process needed for completing the test is ~4x less (148407 oprofile samples vs. 35739) in the case of GPU acceleration.
So we can clearly say that hardware acceleration is indeed used in the pvr driver. It just needs to be improved really a lot before it can provide any practical benefits and successfully pass the trial by cairo traces.
At the risk of boring the readers even more, I'll provide some more data with the regards to how CPU caches affect performance. Pixman library includes a simple crude test program called lowlevel-blt-bench in the "test" directory. It can approximately estimate the performance of various 2D graphics operations depending on the size of the working set (L1 - data fits L1 cache, L2 - data fits L2 cache, M - data does not fit any cache). I have already mentioned it in my older blog post earlier, but probably it will not do much harm repeating a bit. For this particular IGEPv2 board (Cortex-A8 processor running at 1GHz), I can measure the following performance numbers (in MPix/s) with lowlevel-blt-bench:
add_8888_8888 =  L1: 487.07  L2: 441.24  M: 76.53
    over_8888_8888 =  L1: 342.18  L2: 294.20  M: 75.50
Both "Add" and "Over" operators have exactly the same memory access pattern per each pixel: read the source pixel (4 bytes), read the destination pixel (4 bytes), do some calculations and write back the result to the destination (4 bytes). Processing one pixel involves reading 8 bytes and writing 4 bytes, or 12 bytes total. The expected memory performance is a bit difficult to predict, because the bandwidth for memory reads and writes is not equal (memory writes are faster). This device can do ~500-550 MB/s memcpy (1000-1100 MB/s for total read+write bandwidth) and ~1500-1550 MB/s memset. Operators "Add" and "Over" stress memory reads a bit more than writes, so the total cumulative achievable memory bandwidth is slightly worse than the one for memcpy: ~76 MPix/s * 12 * 4 ~= ~900 MB/s. But what matters the most, this synthetic benchmark is also showing that the CPU could easily crunch at least 4x more pixels if the memory subsystem could provide the CPU with the needed data in time! If we are in a situation when the data is not available in CPU L1/L2 caches, then the CPU is working at just 1/4 of its capabilities and idling the rest of the time. I wish we had SMT (or hyperthreading as called by Intel) supported in ARM processors. In this case the other hardware thread would be able to do a lot of work in parallel. Did I say something about a dedicated CPU core being able to act as a 2D accelerator in the previous Cortex-A9 section? Forget that. Even just an extra hardware thread might be enough (if we are doing some simple non-scaled 2D stuff like drawing rectangular windows, using alpha blending for translucency effects and moving them around).
As it turns out, CPU is much faster than memory for simple non-scaled 2D graphics (this includes YUV->RGB conversion, alpha blending, simple copy, fill, ...). Caches are helping really a lot, but they are relatively small and work best when we have good locality for memory accesses. Cairo library is an immediate mode renderer, which is easy to use, but also gives the users the freedom to shoot themselves in the foot. For example, if the user wants to composite many translucent screen sized layers (bigger than L2 cache) on top of each other, then they will be rendered exactly this way, going through slow memory interface for each of these layers over and over again. An obvious optimization is to split the picture into a number of tiles, each small enough to fit L2 or even L1 cache, and then do the blending of all the layers within each tile. This is effective, but requires some effort from the user.
What is the solution? A modern approach is to simply take away the freedom from the users (so that they don't hurt themselves) and enforce a certain performance friendly rendering model. Some people think that scene graph is the silver bullet.
But I have strayed from the original topic already. The pvr driver is what we have for 2D hardware accelerated linux desktop on OMAP3 devices, but it is more like a technical demo and hardly suitable for any practical use. On a positive side, the work is ongoing and xf86-video-omap may eventually become a better 2D driver for this hardware. OMAP4470 is even more promising, as it is going to have a real 2d blitter hardware with the open source drivers for it.
The current 2D driver may be disappointing, but we should not forget that SGX530 is primarily a 3D accelerator with mature and well optimized drivers for OpenGL ES 2.0 (the demos and examples run fine). Also it is worth mentioning that cairo has OpenGL ES 2.0 backend, but it can't be used on SGX530 yet because of missing GL_OES_texture_npot extension support.
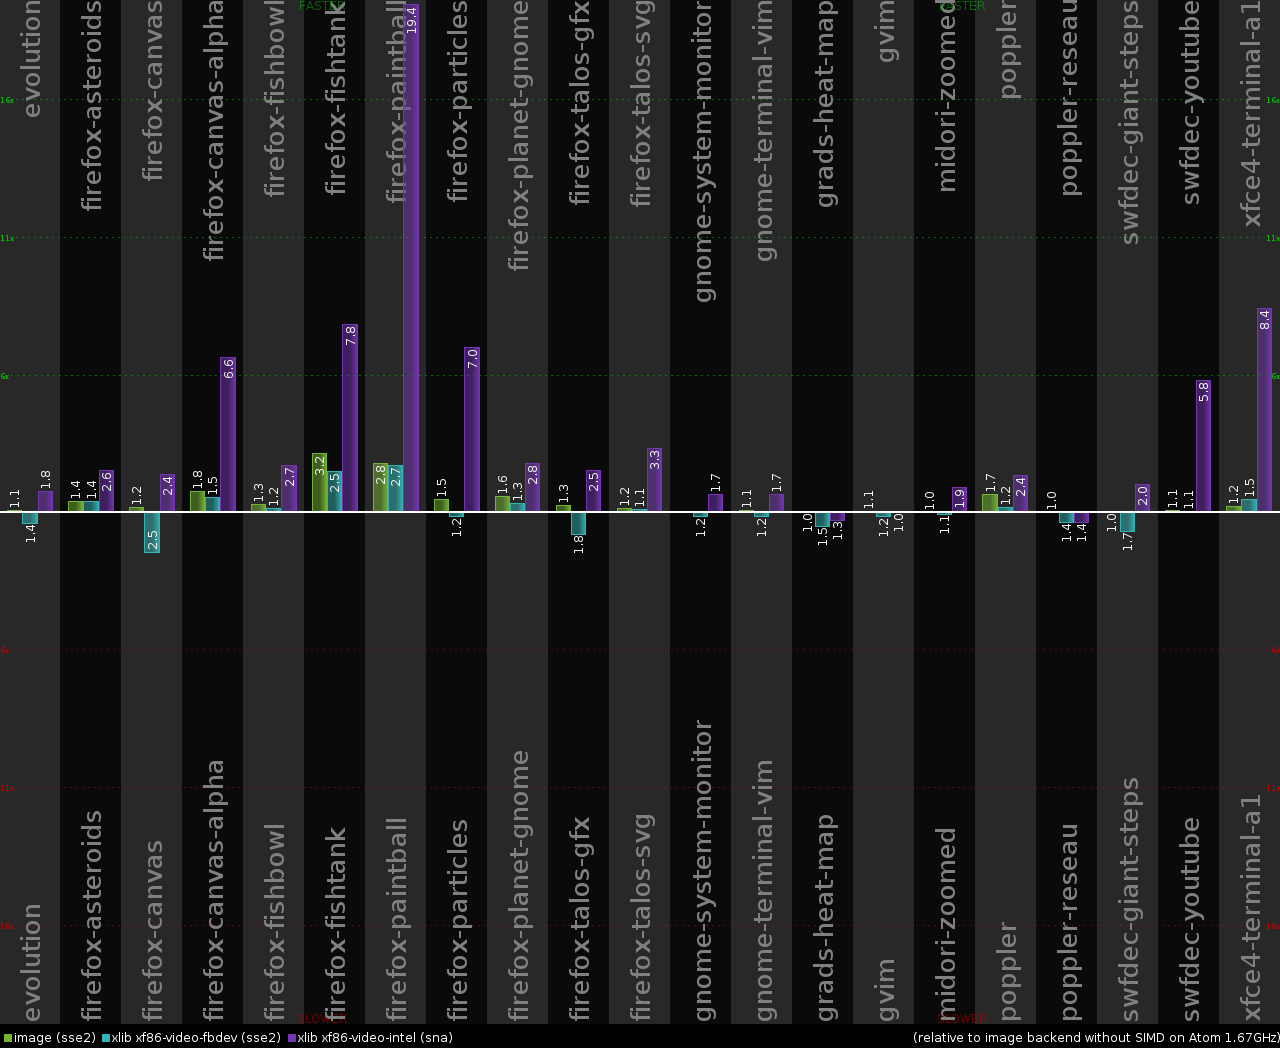
Intel Atom N450 1.67GHz (Samsung N220 netbook)
And for the sake of completeness, here are the results from Intel Atom. They just confirm the results from Chris Wilson and only additionally show the effect of having SSE2 optimizations for the software rendering.
We can also run lowlevel-blt-bench from pixman for the same "Add" and "Over" operations:
add_8888_8888 =  L1: 607.08  L2: 375.34  M:259.53
    over_8888_x888 =  L1: 123.73  L2: 117.10  M:113.56
Now the memory bandwidth is only fully utilized for "Add" operator, but not for "Over". Using a modified variant of render_bench which calculates and reports MPix/s statistics, we can put MPix/s rate for different operations in the following table:
| Compositing operation | performance on Intel Atom N450 |
|---|---|
| pixman non-scaled Add | ~260 MPix/s |
| pixman non-scaled Over | ~110 MPix/s |
| GPU accelerated non-scaled Add | ~270 MPix/s |
| GPU accelerated non-scaled Over | ~270 MPix/s |
| GPU accelerated nearest scaled Over | ~260 MPix/s |
| GPU accelerated bilinear scaled Over | ~260 MPix/s |
All the operations performed on GPU and also software rendered Add run at approximately the same speed, software rendered Over falls behind. It is integrated graphics, both CPU and GPU are using the same memory, so it is not surprising that they both have the same memory performance limit. GPU strength is in handling operations which need more heavy computations. And it is able to fully utilize memory bandwidth regardless of the use of scaling. This is how a really good hardware accelerated driver should behave.
Reproducing these test results and charts
People are generally lazy (me included), so precise step by step instructions may save time and/or encourage somebody to actually try reproducing the tests on his system. First we can try:
$ wget http://cairographics.org/releases/cairo-1.12.0.tar.gz
$ tar -xzf cairo-1.12.0.tar.gz
$ cd cairo-1.12.0
$ ./configure
$ make
$ cd perf
$ make cairo-perf-chart
This will get us "cairo-perf-chart" tool, which can be used to generate nice PNG charts from cairo-perf-trace logs. The cairo-perf-trace logs used for the charts in this blog post are available here.
Compiling cairo library and running the benchmarks can be done in the following way. Obviously, the system needs to have a compiler and some of the build dependencies installed (watch for the error messages from configure scripts). Crosscompilation is also easy, but I have intentionally left it out in order not to add extra confusion.
# set cairo/pixman version and compilation options

export CAIRO_VERSION=1.12.0
export PIXMAN_VERSION=0.25.2
export CFLAGS="-O2 -g"
export CC=gcc
export CAIRO_TEST_TARGET=image

# setup build environment

export PREFIX=`pwd`/tmp
mkdir $PREFIX
export LD_LIBRARY_PATH=$PREFIX/cairo/lib:$PREFIX/pixman/lib
export PKG_CONFIG_PATH=$PREFIX/cairo/lib/pkgconfig:$PREFIX/pixman/lib/pkgconfig

# download and unpack cairo/pixman sources

wget http://cairographics.org/snapshots/pixman-${PIXMAN_VERSION}.tar.gz
wget http://cairographics.org/releases/cairo-${CAIRO_VERSION}.tar.gz
tar -xzf pixman-${PIXMAN_VERSION}.tar.gz
tar -xzf cairo-${CAIRO_VERSION}.tar.gz

# build pixman and cairo

pushd pixman-$PIXMAN_VERSION
./configure --prefix=$PREFIX/pixman && make && make install || exit 1
popd

pushd cairo-$CAIRO_VERSION
./configure --prefix=$PREFIX/cairo && make && make install || exit 1
popd

# download and bind cairo traces (warning: this is a HUGE git repository)

git clone git://anongit.freedesktop.org/cairo-traces
pushd cairo-traces
make
popd

# run cairo-perf-trace benchmarks

cairo-$CAIRO_VERSION/perf/cairo-perf-trace -i3 -r cairo-traces/benchmark > results.txt
This gives us "results.txt" file in raw format, which can be used as an input for cairo-perf-chart tool. If -r option is not used, then the output of cairo-perf-trace is in a more human readable text format. CAIRO_TEST_TARGET environment variable can be set to "image", "xlib" or any other supported backend.
Final words
- Your mileage may vary, but a lot of simple and very common 2D operations do not need a lot of processing power (even one CPU core is excessive). On the other hand, memory bandwidth is critical and directly affects performance.
- On multi-core systems, software rendering in X server may play the role of a 2D accelerator to some extent
- Good quality scaling, rotation, radial gradients, convolution filters and the other processing power hungry operations benefit from GPU acceleration. CPU may obviously also try multithreaded rendering for these operations to take advantage of all CPU cores, but multithreaded rendering is still not supported in pixman.
- The pvr xorg driver is not ready for OMAP3 hardware yet, do not use it
- Disabled acceleration does not always mean full speed software rendering, so if your driver provides an option to disable acceleration, it can't be fully trusted
- Immediate mode renderers such as cairo are a hard challenge for hardware acceleration